Multi-Tool Nasdaq US100 IndikatorA combination of several tools such as moving averages (EMA 50, 100, 200), Fibonacci retracements, pivot points, RSI (Relative Strength Index), order blocks, fair value gaps, supply and demand zones, and a simple volume profile.
The indicator is designed to enable high profitability by combining various established technical analysis approaches into one tool, facilitating decision-making regarding entry and exit points.
The script can be integrated and used directly in TradingView by creating a new indicator script and pasting the code there.
In den Scripts nach "pivot points" suchen

Fractal Pullback Market StructureFractal Pullback Market Structure
Author: The_Forex_Steward
License: Mozilla Public License 2.0
The Fractal Pullback Market Structure indicator is a sophisticated price action tool designed to visualize internal structure shifts and break-of-structure (BoS) events with high accuracy. It leverages fractal pullback logic to identify market swing points and confirm whether a directional change has occurred.
This indicator detects swing highs and lows based on fractal behavior, drawing zigzag lines to connect these key pivot points. It classifies and labels each structural point as either a Higher High (HH), Higher Low (HL), Lower High (LH), or Lower Low (LL). Internal shifts are marked using triangle symbols on the chart, distinguishing bullish from bearish developments.
Break of Structure events are confirmed when price closes beyond the most recent swing high or low, and a horizontal line is drawn at the breakout level. This helps traders validate when a structural trend change is underway.
Users can configure the lookback period that defines the sensitivity of the pullback detection, as well as a timeframe multiplier to align the logic with higher timeframes such as 4H or Daily. There are visual customization settings for the zigzag lines and BoS markers, including color, width, and style (solid, dotted, or dashed).
Alerts are available for each key structural label—HH, HL, LH, LL—as well as for BoS events. These alerts are filtered through a selectable alert mode that separates signals by timeframe category: Low Timeframe (LTF), Medium Timeframe (MTF), and High Timeframe (HTF). Each mode allows the user to receive alerts only when relevant to their strategy.
This indicator excels in trend confirmation and reversal detection. Traders can use it to identify developing structure, validate internal shifts, and anticipate breakout continuation or rejection. It is particularly useful for Smart Money Concept (SMC) traders, swing traders, and those looking to refine entries and exits based on price structure rather than lagging indicators.
Visual clarity, adaptable timeframe logic, and precise structural event detection make this tool a valuable addition to any price action trader’s toolkit.

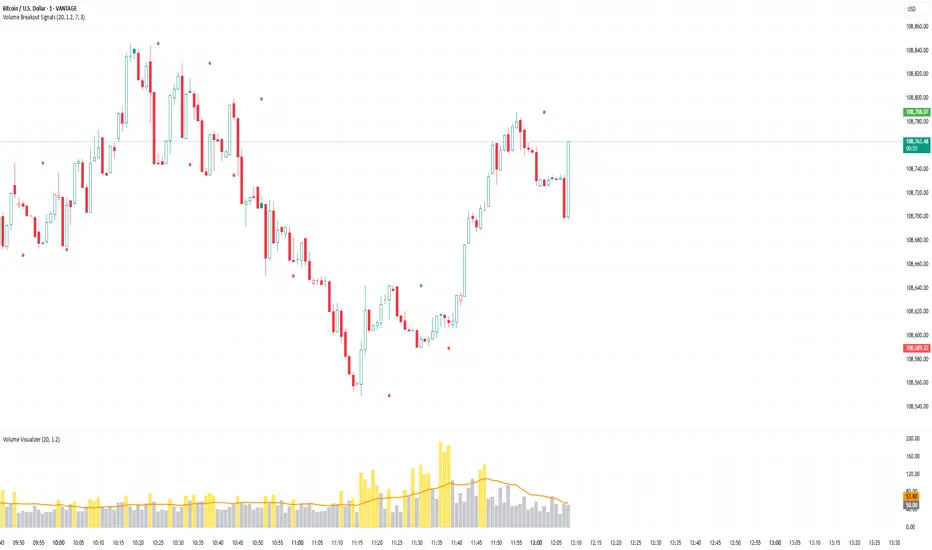
Volume Breakout SignalsScript by Hanssome
The Volume Breakout Signals indicator is a trading tool designed to identify potential entry points by pinpointing high-momentum price breakouts on your main chart. It operates on a simple but powerful principle: a true breakout should be supported by a significant increase in trading volume.
The indicator plots two primary visual elements on your price chart:
Pivot Highs and Lows: These are marked with green and red circles and represent the most recent significant swing points in the price. They act as dynamic support and resistance levels, and the script watches for the price to break past them.
BUY and SELL Labels: These signals appear directly on the chart to indicate a potential trading opportunity.
A signal is only generated when two specific conditions are met simultaneously:
Price Breakout: A BUY signal requires the price to cross decisively above the most recent pivot high. A SELL signal requires the price to cross below the most recent pivot low.
Volume Confirmation: This price breakout must be accompanied by a recent spike in trading volume. This confirmation suggests strong momentum and conviction behind the move, increasing the probability of a successful breakout.
All the parameters, such as the sensitivity of the pivot points and the definition of a volume spike, can be adjusted in the indicator's settings to fit your specific trading style and the asset you are viewing.
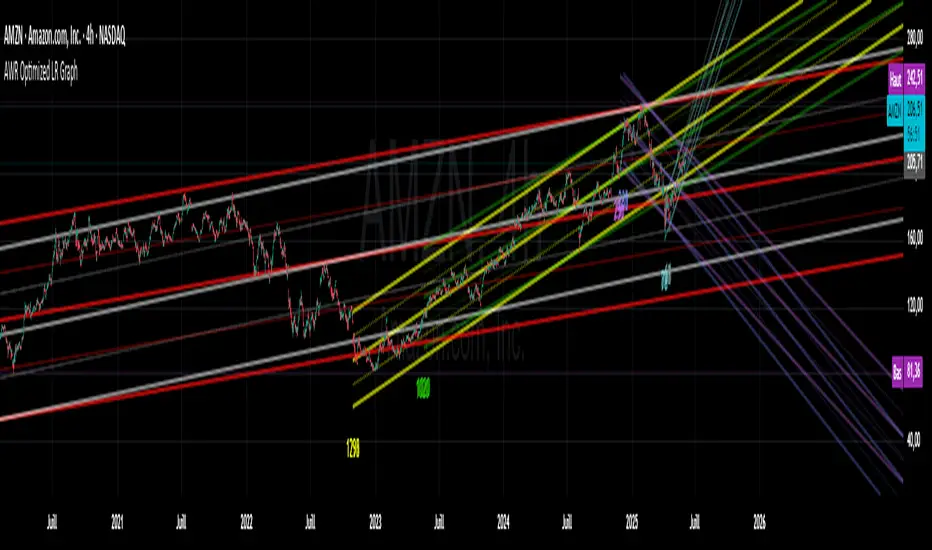
AWR Optimized LR GraphHello Trading Viewers !
Drawing linear regression channels at the best place and for many periods can be time consuming.
In the library, I've found some indicators that draw 1 or 2 but based on fixed number of bars or a duration...
Not always relevant, that's why I decide to create this indicator.
It calculates 8 linear regression channels according to 8 differents configurable periods.
Each time, the indicator will calculate for each specified duration range the best linear regression line & channel (2 standard regressions) for that period and then plot it on the graph.
You can settle how many linear regression channels you want to display.
For period, defaults configurations (number of candles studied) are :
Period 1
min1 = 33
max1 = 66
Period 2
min2 = 67
max2 = 128
Period 3
min3 = 129
max3 = 255
Period 4
min4 = 256
max4 = 510
Period 5
min5 = 511
max5 = 1020
Period 6
min6 = 1021
max6 = 2040
Period 7
min7 = 2041
max7 = 3500
Period 8
min8 = 3501
max8 = 4999
This default settings provide short-term, mid term, long term and a very long-term view.
You have to go back on the chart to display the channels that start on previous period that are currently not on the screen.
You can set a specific color for each linear regression channels.
The linear regression line is based on the least squares method, meaning: it calculates along each period the gap between a linear & the price & squarred it. Then it defines the linear in order to have always the least distance between price and the linear.
The more the price deviates from its regression line, the more statistically likely it is to return to its regression line.
Application of Regression Lines in Trading
Regression lines are widely used in trading and financial analysis to understand market trends and make informed predictions. Here are some key applications:
1. Trend Identification – Traders use regression lines to visualize the general direction of a stock or asset price, helping to confirm an upward or downward trend.
2. Price Predictions – Linear regression models assist in estimating future price movements based on historical data, allowing traders to anticipate changes.
3. Risk Assessment – By analyzing the slope and variation of a regression line, traders can gauge market volatility and potential risks.
4. Support and Resistance Levels – Regression channels help traders identify support and resistance zones, providing insight into optimal entry and exit points in a trend.
5. You can also use the short period linear regression channels vs the long period linear regression channels to identify important pivot points.
CCI Divergence Detector
A technical analysis tool that identifies divergences between price action and the Commodity Channel Index (CCI) oscillator. Unlike standard divergence indicators, this system employs advanced gradient visualization, multi-layer wave effects, and comprehensive customization options to provide traders with crystal-clear divergence signals and market momentum insights.
Core Detection Mechanism
CCI-Based Analysis: The indicator utilizes the Commodity Channel Index as its primary oscillator, calculated from user-configurable source data (default: HLC3) with adjustable length parameters. The CCI provides reliable momentum readings that effectively highlight price-momentum divergences.
Dynamic Pivot Detection: The system employs adaptive pivot detection with three sensitivity levels (High/Normal/Low) to identify significant highs and lows in both price and CCI values. This dynamic approach ensures optimal divergence detection across different market conditions and timeframes.
Dual Divergence Analysis:
Regular Bullish Divergences: Detected when price makes lower lows while CCI makes higher lows, indicating potential upward reversal
Regular Bearish Divergences: Identified when price makes higher highs while CCI makes lower highs, signaling potential downward reversal
Strength Classification System: Each detected divergence is automatically classified into three strength categories (Weak/Moderate/Strong) based on:
-Price differential magnitude
-CCI differential magnitude
-Time duration between pivot points
-User-configurable strength multiplier
Advanced Visual System
Multi-Layer Wave Effects: The indicator features a revolutionary wave visualization system that creates depth through multiple gradient layers around the CCI line. The wave width dynamically adjusts based on ATR volatility, providing intuitive visual feedback about market conditions.
Professional Color Gradient System: Nine independent color inputs control every visual aspect:
Bullish Colors (Light/Medium/Dark): Control oversold areas, wave effects, and strong bullish signals
Bearish Colors (Light/Medium/Dark): Manage overbought zones, wave fills, and strong bearish signals
Neutral Colors (Light/Medium/Dark): Handle table elements, zero line, and transitional states
Intelligent Color Mapping: Colors automatically adapt based on CCI values:
Overbought territory (>100): Bearish color gradients with increasing intensity
Neutral positive (0 to 100): Blend from neutral to bearish tones
Oversold territory (<-100): Bullish color gradients with increasing intensity
Neutral negative (-100 to 0): Transition from neutral to bullish tones
Key Features & Components
Advanced Configuration System: Eight organized input groups provide granular control:
General Settings: System enable, pivot length, confidence thresholds
Oscillator Selection: CCI parameters, overbought/oversold levels, normalization options
Detection Parameters: Divergence types, minimum strength requirements
Sensitivity Tuning: Pivot sensitivity, divergence threshold, confirmation bars
Visual System: Line thickness, labels, backgrounds, table display
Wave Effects: Dynamic width, volatility response, layer count, glow effects
Transparency Controls: Independent transparency for all visual elements
Smoothing & Filtering: CCI smoothing types, noise filtering, wave smoothing
Professional Alert System: Comprehensive alert functionality with dynamic messages including:
-Divergence type and strength classification
-Current CCI value and confidence percentage
-Customizable alert frequency and conditions
Enhanced Information Table: Real-time display showing:
-Current CCI length and value
-Market status (Overbought/Normal/Oversold)
-Active sensitivity setting
Configurable table positioning (4 corner options)
Visual Elements Explained
Primary CCI Line: Main oscillator plot with gradient coloring that reflects market momentum and CCI intensity. Line thickness is user-configurable (1-8 pixels).
Wave Effect Layers: Multi-layer gradient fills creating a dynamic wave around the
CCI line:
-Outer layers provide broad market context
-Inner layers highlight immediate momentum
-Core layers show precise CCI movement
-All layers respond to volatility and momentum changes
Divergence Lines & Labels:
-Solid lines connecting divergence pivot points
-Color-coded based on divergence type and strength
-Labels displaying divergence type and strength classification
-Customizable transparency and size options
Reference Lines:
-Zero line with neutral color coding
-Overbought level (default: 100) with bearish coloring
-Oversold level (default: -100) with bullish coloring
Background Gradient: Optional background coloring that reflects CCI intensity and market conditions with user-controlled transparency (80-99%).
Configuration Options
Sensitivity Controls:
Pivot sensitivity: High/Normal/Low detection levels
Divergence threshold: 0.1-2.0 sensitivity range
Confirmation bars: 1-5 bar confirmation requirement
Strength multiplier: 0.1-3.0 calculation adjustment
Visual Customization:
Line transparency: 0-90% for main elements
Wave transparency: 0-95% for fill effects
Background transparency: 80-99% for subtle background
Label transparency: 0-50% for text elements
Glow transparency: 50-95% for glow effects
Advanced Processing:
Five smoothing types: None/SMA/EMA/RMA/WMA
Noise filtering with adjustable threshold (0.1-10.0)
CCI normalization for enhanced gradient scaling
Dynamic wave width with ATR-based volatility response
Interpretation Guidelines
Divergence Signals:
Strong divergences: High-confidence reversal signals requiring immediate attention
Moderate divergences: Reliable signals suitable for most trading strategies
Weak divergences: Early warning signals best combined with additional confirmation
Wave Intensity: Wave width and color intensity provide real-time volatility and momentum feedback. Wider, more intense waves indicate higher market volatility and stronger momentum.
Color Transitions: Smooth color transitions between bullish, neutral, and bearish states help identify market regime changes and momentum shifts.
CCI Levels: Traditional overbought (>100) and oversold (<-100) levels remain relevant, but the gradient system provides more nuanced momentum reading between these extremes.
Technical Specifications
Compatible Timeframes: All timeframes supported
Maximum Labels: 500 (for divergence marking)
Maximum Lines: 500 (for divergence drawing)
Pine Script Version: v5 (latest optimization)
Overlay Mode: False (separate pane indicator)
Usage Recommendations
This indicator works best when:
-Combined with price action analysis and support/resistance levels
-Used across multiple timeframes for confirmation
-Integrated with proper risk management protocols
-Applied in trending markets for divergence-based reversal signals
-Utilized with other technical indicators for comprehensive analysis
Risk Disclaimer: Trading involves substantial risk of loss. This indicator is provided for analytical purposes only and does not constitute financial advice. Divergence signals, while powerful, are not guaranteed to predict future price movements. Past performance is not indicative of future results. Always use proper risk management and never trade with capital you cannot afford to lose.

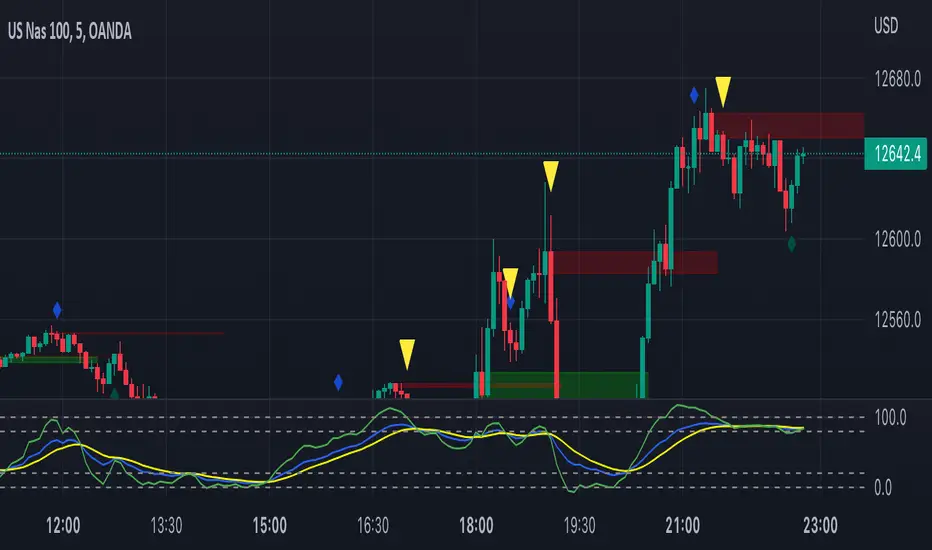
The Traders Support & Resistance LevelsThis script automatically detects pivot-based support and resistance levels and draws dynamic trendlines based on recent price action.
🔹 Support & Resistance Levels
Pivot points are calculated using customizable left/right bar logic. A pivot high (or low) is confirmed when leftBars candles to the left and rightBars candles to the right are lower (or higher).
Triangles are plotted when a level is confirmed:
🔻 🟡 Yellow Down Triangle = Confirmed Resistance
🔺 🟣 Purple Up Triangle = Confirmed Support
Lines are drawn at confirmed levels.
If enough lines are confirmed, the oldest one is converted into a zone using a thick, semi-transparent line.
🔹 Trendline Logic
Trendlines are drawn between the last two support points (for uptrend) and last two resistance points (for downtrend).
The slope and price relationship determine trend strength, visualized by color:
Condition Color Meaning
Uptrend + Price Above + Steep 🟨 Yellow Strong Uptrend
Uptrend + Price Above 🔷 Blue Weak Uptrend
Downtrend + Price Below + Steep 💗 Fuchsia Strong Downtrend
Downtrend + Price Below 🟣 Purple Weak Downtrend
Otherwise ⚪️ Gray Neutral / No Trend
⚙️ Customizable Inputs
leftBars, rightBars: Adjust sensitivity of pivot detection
previewBars: Show early "draft" lines before confirmation
volumeThresh: Reserved for future enhancements

The LBF modelThe LBF Model is a structural pattern detector that highlights potential reversal zones using a specific sequence of pivot points. It identifies both bearish (LL → LH → LL → HH → LH) and bullish (HH → HL → HH → LL → HL) formations, marking moments where price shows signs of exhaustion and directional shift.
Built purely on price action, the LBF Model avoids indicators and focuses on clean structure. It draws patterns directly on the chart, with customizable sensitivity and colors. Whether used on its own or with other tools, it helps traders spot key turning points with clarity and precision.

Breakout Support & Resistance SwiftEdgeBreakout Support & Resistance
The Breakout is a technical analysis tool designed to identify breakout opportunities in the market by detecting price movements through support and resistance levels. It plots potential entry points, stop-loss (SL), and take-profit (TP) levels based on user-defined percentages, helping traders visualize breakout setups on their charts.
How It Works
Support and Resistance Detection: The indicator uses pivot points to identify support and resistance levels over a user-defined lookback period.
Breakout Identification: A breakout is confirmed when the price crosses above a resistance level (bullish) or below a support level (bearish) and remains there for a specified number of bars.
Entry, SL, and TP Levels: Upon a confirmed breakout, the indicator sets an entry point at the closing price and calculates SL, TP1, and TP2 levels based on user-defined percentages.
Directional Filtering: To avoid conflicting signals, the indicator filters breakouts based on the current trade direction. A new entry in the opposite direction is only set if the price moves a user-defined percentage away from the previous entry or if the previous trade hits its SL, TP1, or TP2.
Visuals: The indicator plots support and resistance lines, breakout labels, and entry/SL/TP levels on the chart. Users can choose to display only the latest entry or up to 5 recent entries.
Features
Customizable Settings: Adjust the lookback period for pivot points, breakout confirmation bars, SL/TP percentages, and more.
Directional Change Control: A direction change is indicated when the price moves significantly in the opposite direction, helping to manage trend reversals.
Multiple Entry Display: Option to show up to 5 recent entries for tracking multiple breakouts.
Alerts: Receive alerts when a breakout is confirmed, including entry, SL, TP1, and TP2 levels.
Settings
Pivot Lookback Length: Number of bars to look back for identifying support and resistance levels (default: 5).
Breakout Confirmation Bars: Number of bars the price must stay above/below the level to confirm a breakout (default: 2).
Take Profit 1 (%): First take-profit level as a percentage above/below the entry (default: 2.0%).
Take Profit 2 (%): Second take-profit level as a percentage above/below the entry (default: 4.0%).
Stop Loss (%): Stop-loss level as a percentage below/above the entry (default: 1.0%).
Show Multiple Entries: Toggle to display up to 5 recent entries or only the latest (default: false).
Direction Change Threshold (%): Percentage the price must move away from the entry to allow a direction change (default: 2.0%).
How to Use
Add the Breakout Scanner to your chart.
Adjust the settings to match your trading style (e.g., tweak the pivot lookback or SL/TP percentages).
Watch for breakout labels ("Breakout") on the chart, indicating a confirmed breakout.
Use the plotted entry, SL, TP1, and TP2 levels to plan your trades.
Enable alerts to be notified of new breakouts in real-time.
Notes
This indicator is designed to assist with identifying breakout opportunities and does not guarantee specific results. Always combine it with other analysis and risk management techniques.
The direction change feature helps filter breakouts in the opposite direction, but significant price movements may still trigger a new entry in the opposite direction.
For best results, test the indicator on a demo account to understand its behavior in your preferred market and timeframe.

Relative Vigor Index (RVI) with EMD [AIBitcoinTrend]👽 Adaptive Relative Vigor Index with EMD & Signals (AIBitcoinTrend)
The Adaptive Relative Vigor Index (RVI) with Empirical Mode Decomposition (EMD) is an enhanced version of the traditional RVI, designed to improve signal clarity and responsiveness to market conditions. By integrating EMD smoothing and adaptive volatility-based trailing stops.
👽 What Makes the Adaptive RVI with EMD Unique?
Unlike the standard RVI, which often lags in volatile markets, this version refines price momentum detection by applying Empirical Mode Decomposition (EMD), effectively filtering out noise. Additionally, it features ATR-based trailing stops for precise trade execution.
Key Features:
EMD-Enhanced RVI – Filters out short-term noise, improving signal accuracy.
Crossover & Crossunder Signals – Generates trade signals based on RVI trends.
ATR-Based Trailing Stop – Adjusts dynamically based on volatility for optimal risk management.
👽 The Math Behind the Indicator
👾 RVI Calculation with EMD Smoothing
The Relative Vigor Index (RVI) measures trend strength by comparing the relationship between closing and opening prices, relative to the high-low range. Traditional RVI uses fixed smoothing, whereas this version applies Empirical Mode Decomposition (EMD) to extract dominant price cycles and improve trend clarity.
How It Works:
The RVI is initially calculated using a weighted moving average (WMA) over a specified period.
EMD refines the RVI signal by removing high-frequency noise, creating a smoothed RVI component.
This results in a more stable and reliable trend indicator.
👽 How Traders Can Use This Indicator
👾 Trailing Stop & Signal-Based Trading
Bullish Setup:
✅ RVI crosses above EMD → Buy signal.
✅ A bullish trailing stop is placed at low - ATR × Multiplier.
✅ Exit if price crosses below the stop.
Bearish Setup:
✅ RVI crosses below EMD → Sell signal.
✅ A bearish trailing stop is placed at high + ATR × Multiplier.
✅ Exit if price crosses above the stop.
👾 Detecting Overbought & Oversold Areas
This indicator helps traders identify potential reversal zones by highlighting overbought and oversold conditions.
Overbought Zone: When RVI moves above 0.4, the market may be overextended, signaling a potential reversal downward.
Oversold Zone: When RVI moves below -0.4, the market may be undervalued, suggesting a possible upward reversal.
Using these levels, traders can confirm entry and exit points alongside divergence signals for higher probability trades.
👽 Why It’s Useful for Traders
EMD-Based Signal Enhancement: Filters out noise, refining momentum signals.
Adaptive ATR-Based Risk Management: Automatically adjusts stop-loss levels to market conditions.
Works Across Multiple Markets & Timeframes: Effective for stocks, forex, crypto, and futures trading.
👽 Indicator Settings
RVI Length – Defines the period for calculating the Relative Vigor Index.
EMD Period – Controls the level of EMD smoothing applied.
Final Smoothing – Adjusts the degree of additional signal filtering.
Lookback Period – Determines how many bars are used for detecting pivot points.
Enable Trailing Stop – Activates dynamic ATR-based trailing stops.
ATR Multiplier – Adjusts the stop-loss sensitivity.
Disclaimer: This indicator is designed for educational purposes and does not constitute financial advice. Please consult a qualified financial advisor before making investment decisions.

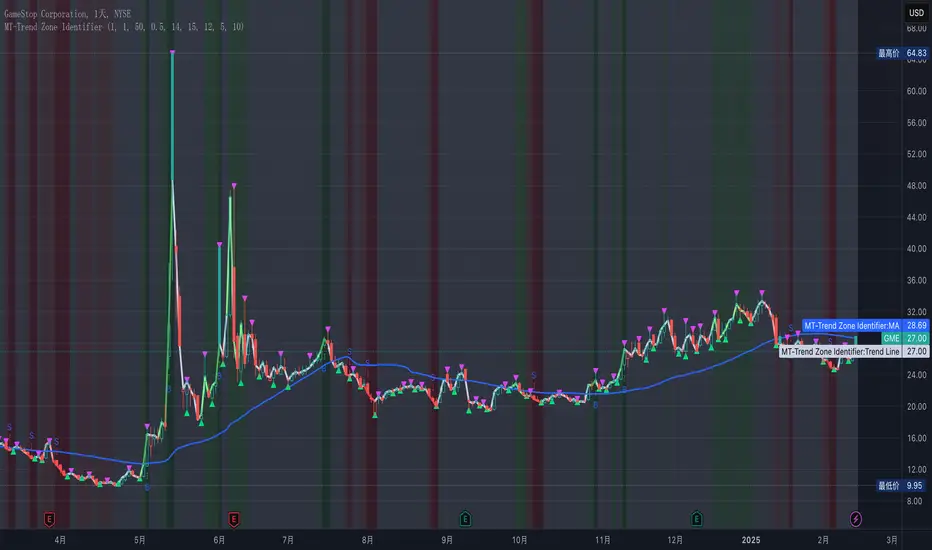
MT-Trend Zone IdentifierTrend Zone Identifier – A Dynamic Market Trend Mapping Tool
Overview
The Trend Zone Identifier is an advanced TradingView indicator that helps traders visualize different market trend phases. By leveraging Pivot Points, Moving Averages (MA), ADX (Average Directional Index), and Retest Confirmation, this tool identifies uptrend, downtrend, and ranging (sideways) conditions dynamically.
This indicator is designed to segment the market into clear trend zones, allowing traders to distinguish between confirmed trends, trend transitions (pending zones), and ranging markets. It provides an intuitive visual overlay to enhance market structure analysis and assist in decision-making.
Key Features
✔ Trend Zone Identification – Classifies price action into Uptrend (Green), Downtrend (Red), Pending Confirmation (Light Colors), and Sideways Market (Gray/Neutral)
✔ Pivot-Based Breakout & Breakdown Detection – Uses pivot highs/lows to determine trend shifts
✔ Moving Average & ADX Validation – Ensures the trend is backed by MA structure and ADX trend strength
✔ Pullback Confirmation – Allows trend confirmation based on price retesting key levels
✔ Extreme Volatility & Gaps Filtering – Optional ATR-based extreme movement filtering to avoid false signals
✔ Multi-Timeframe Support – Option to integrate higher timeframe trend validation
✔ Customizable Sensitivity – Fine-tune MA smoothing, ADX thresholds, pivot detection, and pullback range
How It Works
1. Trend Classification
• Uptrend (Green): Price is above a key MA, ADX confirms strength, and a pivot breakout occurs
• Downtrend (Red): Price is below a key MA, ADX confirms strength, and a pivot breakdown occurs
• Pending Trend (Light Colors): Initial trend breakout or breakdown is detected but requires further confirmation
• Sideways/Ranging (Gray): ADX signals a weak trend, and price remains within a neutral zone
2. Retest & Confirmation Logic
• A trend is only confirmed after a breakout or breakdown followed by a successful retest
• If the market fails the retest, the indicator resets to a neutral state
3. Custom Filters for Optimization
• Enable or disable volume filtering for confirmation
• Adjust pivot sensitivity to detect major or minor swing points
• Choose to require consecutive bars confirming the breakout/breakdown
Ideal Use Cases
🔹 Swing traders who want to capture trend transitions early
🔹 Trend-following traders who rely on confirmed market cycles
🔹 Range traders looking to identify sideways market zones
🔹 Algorithmic traders who need clean trend segmentation for automated strategies
Final Thoughts
The Trend Zone Identifier is a versatile market structure indicator that helps traders define trend cycles visually and avoid trading against weak trends. By providing clear breakout, breakdown, and retest conditions, it enhances market clarity and reduces decision-making errors.
➡ Add this to your TradingView workspace and start analyzing market trends like a pro! 🚀
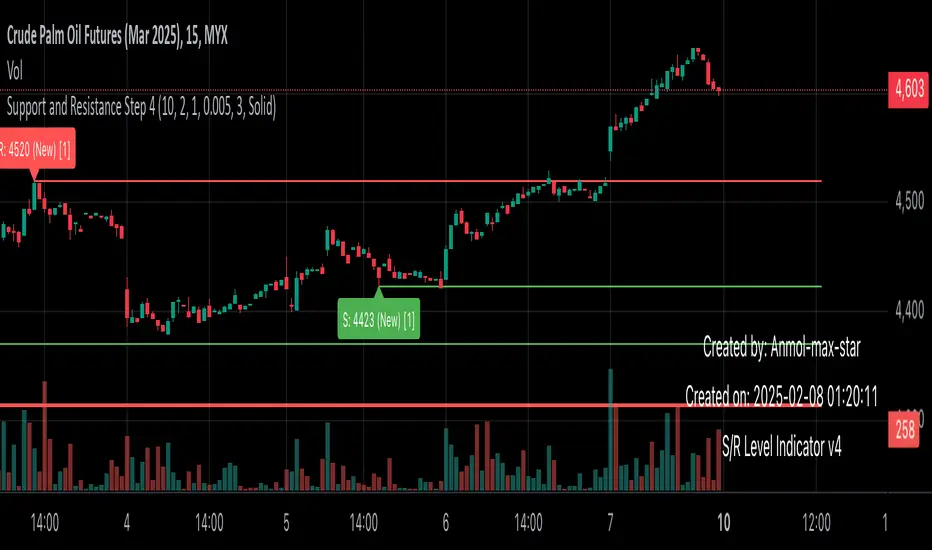
Support and Resistance all in one The Support and Resistance Indicator (v4) is designed to identify and track key price levels in financial markets. Here's how it works:
Core Functionality
Level Detection
Uses pivot points to identify significant price levels
Looks for swing highs (resistance) and swing lows (support)
Requires price action to pivot over a specified period (default 10 bars)
Dynamic Level Management
Maintains separate arrays for support and resistance levels
Limits maximum displayed levels (default 10) to prevent chart clutter
Removes oldest levels when maximum is reached
Ensures new levels are sufficiently distant from existing ones (minimum 1% separation)
Touch Detection System
Monitors price interaction with established levels
Counts when price comes within 0.1% of any level
Updates touch count and strength classification
Categories: "New" (1 touch), "Moderate" (2 touches), "Strong" (3+ touches)
Visual Representation
Draws horizontal lines at each level
Updates line width based on strength (thicker for stronger levels)
Shows labels with price and strength information
Color coding: Red (new/moderate levels), Green (strong levels)
Displays triangles (▼▲) at pivot points
Trading Applications
Support/Resistance Trading
Strong levels (3+ touches) suggest reliable trading zones
More touches indicate higher probability reversal points
Use for stop loss and target placement
Breakout Trading
Monitor breaks of strong levels
Higher touch count suggests more significant breakouts
Watch for false breakouts at weaker levels
Risk Management
Place stops beyond strong levels
Use level strength to adjust position size
Consider multiple timeframe analysis
Best Practices
Use with other indicators for confirmation
Consider market context and trend
Monitor level strength development
Don't rely solely on touch count
Watch for price reaction at levels
Customization Options
Adjust pivot length for different timeframes
Modify minimum distance between levels
Change required touches for "Strong" classification
Toggle strength labels display
Choose line style (Solid/Dashed/Dotted)
This indicator helps identify key price levels where market participants have shown interest, making it valuable for trade planning and risk management
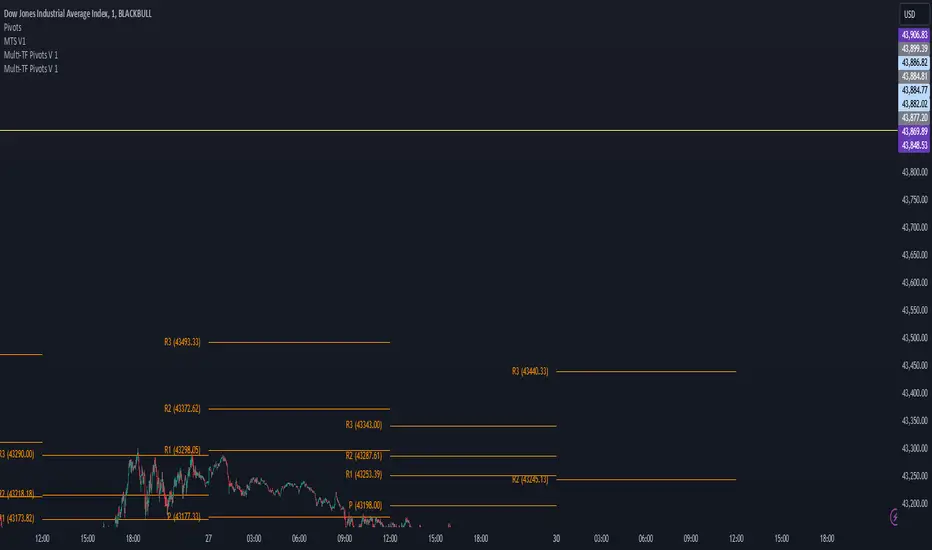
Multi-TF Pivots V1The Multi-TF Pivots Indicator is a powerful and customizable pivot point tool for TradingView. This script allows traders to calculate and display pivot points on a wide range of timeframes, from 1-minute to weekly intervals. It supports both Classic and Fibonacci pivot styles and includes options to customize line colors, label positions, and price visibility. The indicator is ideal for traders who rely on pivot points for intraday and swing trading strategies, offering a clear visual representation of key support and resistance levels. With its flexibility and comprehensive features, this indicator is an essential tool for precise technical analysis.
اندیکاتور Multi-TF Pivots یک ابزار قدرتمند و قابل تنظیم برای محاسبه و نمایش پیوت پوینتها در پلتفرم TradingView است. این اسکریپت به معاملهگران امکان میدهد پیوت پوینتها را در طیف گستردهای از تایمفریمها، از ۱ دقیقه تا هفتگی، محاسبه و نمایش دهند. این اندیکاتور از سبکهای پیوت Classic و Fibonacci پشتیبانی میکند و گزینههایی برای شخصیسازی رنگ خطوط، موقعیت برچسبها و نمایش قیمتها دارد. این ابزار برای معاملهگرانی که به پیوت پوینتها برای استراتژیهای معاملاتی روزانه و نوسانی متکی هستند ایدهآل است و نمایش بصری واضحی از سطوح کلیدی حمایت و مقاومت ارائه میدهد. با انعطافپذیری و ویژگیهای جامع خود، این اندیکاتور یک ابزار ضروری برای تحلیل تکنیکال دقیق است
Double Top/Bottom [AlgoAlpha]Introducing the Double Top/Bottom Indicator by AlgoAlpha, a powerful tool designed to identify key reversal patterns in the market with precision. This indicator meticulously detects double tops and double bottoms, helping traders recognize potential trend reversals and make informed trading decisions.
Key Features:
🔍 Pattern Detection : Accurately identifies double top and double bottom formations based on customizable time horizons.
🎨 Customizable Appearance : Choose your preferred colors for bullish and bearish trends to match your trading style.
📊 Signal Labels : Option to display only the second pivot of the double top/bottom for a cleaner chart view.
🔧 Flexible Settings : Adjust the time horizon to control the look-back period, allowing for detection of both short-term and long-term patterns.
📈 Visual Enhancements : Draws trend lines and fills between pivotal points to visually highlight potential reversal zones.
🔔 Alerts : Set up alerts for potential double top and double bottom formations to stay informed of key market movements.
How to Use the Double Top/Bottom Indicator :
🛠 Add the Indicator : Simply add the Double Top/Bottom Indicator to your TradingView chart from your favorites. Customize the time horizon and appearance settings to fit your trading preferences.
📊 Analyze Patterns : Watch for the identified double top and double bottom patterns along with the corresponding trend lines and filled areas to anticipate potential market reversals.
🔔 Set Alerts : Enable alerts to receive notifications when double top or double bottom patterns are detected, ensuring you never miss a critical trading opportunity.
How It Works : The indicator scans the price action for pivot highs and lows within a specified time horizon, identifying potential double top and double bottom patterns. It maintains a sequence of these pivots and verifies the formation of these patterns based on the relationship between consecutive pivots and the proximity to a defined limit. When a double top or double bottom is confirmed, the indicator marks the second pivot point with a label and draws trend lines to visualize the reversal pattern. Additionally, it provides alert conditions to notify traders of potential confirmations, enhancing decision-making without cluttering the chart.
⚠️ Important Reminder : The labels indicating double tops and bottoms appear with a delay and are intended to mark the formations after they have already formed. They are not meant to be used as real-time trading signals. While they align perfectly with pivot points in hindsight, please use them as markers for analysis rather than immediate trading triggers.

Pivotal Point Detection
The indicator highlights price gaps (overnight gaps) with significantly increased volume in the daily chart only. These price jumps can occur after earnings reports or other significant news and often point to an important event (e.g., a new product or business model). According to Jesse Livermore, these are called Pivotal Points.
The price jumps displayed by the indicator are not a guarantee that they represent a true Pivotal Point, but they provide a hint of a significant business development - especially when they occur repeatedly alongside revenue growth. This can help identify potentially strong growth stocks and high-performing investments. However, the underlying events and connections must be investigated through additional research.
make posible to find stocks like:
NYSE:PLTR NASDAQ:ROOT NASDAQ:NVDA NYSE:CVNA NYSE:LRN
A "pivotal price line" is drawn at the opening price of the Pivotal Point. This line is considered a support level. If the price falls below this line, the Pivotal Point loses its validity.

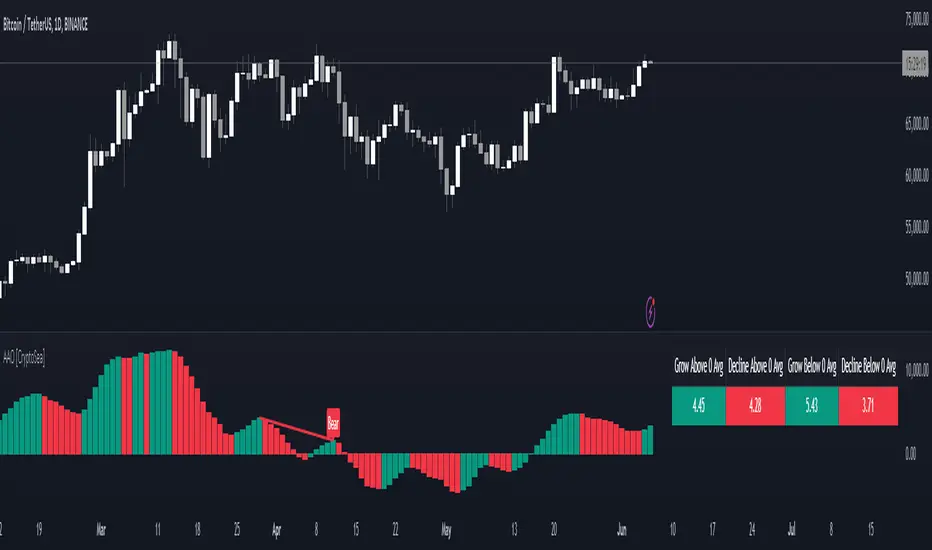
Advanced Awesome Oscillator [CryptoSea]Advanced AO Analysis Indicator
The Advanced AO Analysis indicator is a sophisticated tool designed to evaluate the Awesome Oscillator (AO) in search of regular and hidden divergences that signal potential price reversals. By tracking the intensity and duration of the AO's movements, this indicator aids traders in pinpointing critical points in price action.
Key Features
Divergence Detection: Identifies both regular and hidden bullish and bearish divergences, providing early signs of potential market reversals.
Customizable Lookback Periods: Allows users to set specific lookback windows to define the strength and relevance of detected divergences.
Adaptive Oscillator Display: Features customizable display options for the AO, enabling users to view data in different modes suited to their analysis needs.
Alert System: Includes configurable alerts to notify users of potential divergence formations, helping traders respond promptly.
How it Works
AO Calculation: Computes the AO as the difference between short-term and long-term moving averages of the midpoints of bars, highlighting momentum shifts.
Pivot Point Analysis: Utilizes advanced algorithms to find low and high pivot points based on the oscillator values, crucial for spotting trend reversals.
Range Validation: Verifies that divergences occur within a predefined range from pivot points, ensuring their validity and strength.
Visualisation: Plots AO values and potential divergences directly on the chart, aiding in quick visual analysis.
Application
Strategic Decision-Making: Assists traders in making informed decisions by providing detailed analysis of AO movements and divergence.
Trend Confirmation: Reinforces trading strategies by confirming potential reversals with pivot point detection and divergence analysis.
Behavioural Insight: Offers insights into market dynamics and sentiment by analyzing the depth and duration of AO cycles above and below zero.
The Advanced AO Analysis indicator equips traders with a powerful analytical tool for studying the Awesome Oscillator in-depth, enhancing their ability to spot and act on divergence-based trading opportunities in the cryptocurrency markets.
CPR LinesThe "CPR Lines" script, written in Pine Script version 5, is designed for use in the TradingView platform to help traders visualize Central Pivot Range (CPR) levels on their price charts. This script calculates and plots three essential pivot levels based on the prior trading day's high, low, and close prices, providing traders with key reference points for potential support and resistance levels in the current trading session.
Key Features:
Prior Day's Data Calculation:
The script retrieves the high, low, and close prices of the previous trading day using the request.security function. These values are crucial for calculating the CPR levels.
Central Pivot Line (CPL):
The CPL is calculated as the average of the prior day's high, low, and close prices. It serves as the primary pivot point around which the price action is likely to revolve.
Bottom Central Pivot (BCP):
The BCP is calculated as the average of the prior day's high and low prices. This level often acts as a support line in a bullish trend.
Top Central Pivot (TCP):
The TCP is derived by adding the difference between CPL and BCP to the CPL itself. This level can serve as a resistance line in a bearish trend.
Plotting the CPR Levels:
The script plots the CPL, BCP, and TCP on the chart with distinct black lines for easy identification. Each line is labeled accordingly and plotted with a linewidth of 2 for better visibility.
This script aids traders by providing visual cues for key price levels, enhancing their ability to make informed trading decisions based on historical price movements. By incorporating these pivot points, traders can better predict potential price reactions and plan their trades accordingly.

ZigZag Library [TradingFinder]🔵 Introduction
The "Zig Zag" indicator is an analytical tool that emerges from pricing changes. Essentially, it connects consecutive high and low points in an oscillatory manner. This method helps decipher price changes and can also be useful in identifying traditional patterns.
By sifting through partial price changes, "Zig Zag" can effectively pinpoint price fluctuations within defined time intervals.
🔵 Key Features
1. Drawing the Zig Zag based on Pivot points :
The algorithm is based on pivots that operate consecutively and alternately (switch between high and low swing). In this way, zigzag lines are connected from a swing high to a swing low and from a swing low to a swing high.
Also, with a very low probability, it is possible to have both low pivots and high pivots in one candle. In these cases, the algorithm tries to make the best decision to make the most suitable choice.
You can control what period these decisions are based on through the "PiPe" parameter.
2.Naming and labeling each pivot based on its position as "Higher High" (HH), "Lower Low" (LL), "Higher Low" (HL), and "Lower High" (LH).
Additionally, classic patterns such as HH, LH, LL, and HL can be recognized. All traders analyzing financial markets using classic patterns and Elliot Waves can benefit from the "zigzag" indicator to facilitate their analysis.
" HH ": When the price is higher than the previous peak (Higher High).
" HL ": When the price is higher than the previous low (Higher Low).
" LH ": When the price is lower than the previous peak (Lower High).
" LL ": When the price is lower than the previous low (Lower Low).
🔵 How to Use
First, you can add the library to your code as shown in the example below.
import TFlab/ZigZagLibrary_TradingFinder/1 as ZZ
Function "ZigZag" Parameters :
🟣 Logical Parameters
1. HIGH : You should place the "high" value here. High is a float variable.
2. LOW : You should place the "low" value here. Low is a float variable.
3. BAR_INDEX : You should place the "bar_index" value here. Bar_index is an integer variable.
4. PiPe : The desired pivot period for plotting Zig Zag is placed in this parameter. For example, if you intend to draw a Zig Zag with a Swing Period of 5, you should input 5.
PiPe is an integer variable.
Important :
Apart from the "PiPe" indicator, which is part of the customization capabilities of this indicator, you can create a multi-time frame mode for the indicator using 3 parameters "High", "Low" and "BAR_INDEX". In this way, instead of the data of the current time frame, use the data of other time frames.
Note that it is better to use the current time frame data, because using the multi-time frame mode is associated with challenges that may cause bugs in your code.
🟣 Setting Parameters
5. SHOW_LINE : It's a boolean variable. When true, the Zig Zag line is displayed, and when false, the Zig Zag line display is disabled.
6. STYLE_LINE : In this variable, you can determine the style of the Zig Zag line. You can input one of the 3 options: line.style_solid, line.style_dotted, line.style_dashed. STYLE_LINE is a constant string variable.
7. COLOR_LINE : This variable takes the input of the line color.
8. WIDTH_LINE : The input for this variable is a number from 1 to 3, which is used to adjust the thickness of the line that draws the Zig Zag. WIDTH_LINE is an integer variable.
9. SHOW_LABEL : It's a boolean variable. When true, labels are displayed, and when false, label display is disabled.
10. COLOR_LABEL : The color of the labels is set in this variable.
11. SIZE_LABEL : The size of the labels is set in this variable. You should input one of the following options: size.auto, size.tiny, size.small, size.normal, size.large, size.huge.
12. Show_Support : It's a boolean variable that, when true, plots the last support line, and when false, disables its plotting.
13. Show_Resistance : It's a boolean variable that, when true, plots the last resistance line, and when false, disables its plotting.
Suggestion :
You can use the following code snippet to import Zig Zag into your code for time efficiency.
//import Library
import TFlab/ZigZagLibrary_TradingFinder/1 as ZZ
// Input and Setting
// Zig Zag Line
ShZ = input.bool(true , 'Show Zig Zag Line', group = 'Zig Zag') //Show Zig Zag
PPZ = input.int(5 ,'Pivot Period Zig Zag Line' , group = 'Zig Zag') //Pivot Period Zig Zag
ZLS = input.string(line.style_dashed , 'Zig Zag Line Style' , options = , group = 'Zig Zag' )
//Zig Zag Line Style
ZLC = input.color(color.rgb(0, 0, 0) , 'Zig Zag Line Color' , group = 'Zig Zag') //Zig Zag Line Color
ZLW = input.int(1 , 'Zig Zag Line Width' , group = 'Zig Zag')//Zig Zag Line Width
// Label
ShL = input.bool(true , 'Label', group = 'Label') //Show Label
LC = input.color(color.rgb(0, 0, 0) , 'Label Color' , group = 'Label')//Label Color
LS = input.string(size.tiny , 'Label size' , options = , group = 'Label' )//Label size
Show_Support= input.bool(false, 'Show Last Support',
tooltip = 'Last Support' , group = 'Support and Resistance')
Show_Resistance = input.bool(false, 'Show Last Resistance',
tooltip = 'Last Resistance' , group = 'Support and Resistance')
//Call Function
ZZ.ZigZag(high ,low ,bar_index ,PPZ , ShZ ,ZLS , ZLC, ZLW ,ShL , LC , LS , Show_Support , Show_Resistance )

DMI StrategyThis strategy is based on DMI indicator. It helps me to identify base or top of the script. I mostly use this script to trade in Nifty bank options, even when the signal comes in nifty . It can be used to trade in other scripts as well. Pivot points can also be used to take entry. Long entry is taken when DI+(11) goes below 10 and DI-(11) goes above 40 , whereas short entry is taken when DI-(11) goes below 10 and DI+(11) goes above 40.
For bank nifty , I take the trade in the strike price for which the current premium is nearby 300, with the SL of 20%. If premium goes below 10% I buy one more lot to average, but exit if the premium goes below 20% of the first entry. If the trade moves in the correct direction, we need to start trailing our stoploss or exit at the pre-defined target.
As this a strategy, there is one problem. While we are in the phase of "long", if again the "long" phase comes, it will not be shown on chart until a "short" phase has come, and vice versa. This has been resolved by creating an indicator instead of strategy with the name of "DMI Buy-sell on chart". Please go through that to get more entry points.
Please have a look at strategy tester to back test

Turk Pivot Candle Order BlocksOrder Blocks based on pivot reversal candle
When a pivot High or Pivot Low is found and confirmed, a box will be plotted on the open and close values of that pivot candle
You also have the ability to change the amount of candles the box stretches over as well as the colors of the bullish and bearish boxes
How To Use:-
Pivot points often provide Support and Resistance points on their own,
one way of marking up order blocks is by taking the pivot candle and marking that up as a resistance area where you could be looking for price to reverse
Time█ OVERVIEW
This library is a Pine Script™ programmer’s tool containing a variety of time related functions to calculate or measure time, or format time into string variables.
█ CONCEPTS
`formattedTime()`, `formattedDate()` and `formattedDay()`
Pine Script™, like many other programming languages, uses timestamps in UNIX format, expressed as the number of milliseconds elapsed since 00:00:00 UTC, 1 January 1970. These three functions convert a UNIX timestamp to a formatted string for human consumption.
These are examples of ways you can call the functions, and the ensuing results:
CODE RESULT
formattedTime(timenow) >>> "00:40:35"
formattedTime(timenow, "short") >>> "12:40 AM"
formattedTime(timenow, "full") >>> "12:40:35 AM UTC"
formattedTime(1000 * 60 * 60 * 3.5, "HH:mm") >>> "03:30"
formattedDate(timenow, "short") >>> "4/30/22"
formattedDate(timenow, "medium") >>> "Apr 30, 2022"
formattedDate(timenow, "full") >>> "Saturday, April 30, 2022"
formattedDay(timenow, "E") >>> "Sat"
formattedDay(timenow, "dd.MM.yy") >>> "30.04.22"
formattedDay(timenow, "yyyy.MM.dd G 'at' hh:mm:ss z") >>> "2022.04.30 AD at 12:40:35 UTC"
These functions use str.format() and some of the special formatting codes it allows for. Pine Script™ documentation does not yet contain complete specifications on these codes, but in the meantime you can find some information in the The Java™ Tutorials and in Java documentation of its MessageFormat class . Note that str.format() implements only a subset of the MessageFormat features in Java.
`secondsSince()`
The introduction of varip variables in Pine Script™ has made it possible to track the time for which a condition is true when a script is executing on a realtime bar. One obvious use case that comes to mind is to enable trades to exit only when the exit condition has been true for a period of time, whether that period is shorter that the chart's timeframe, or spans across multiple realtime bars.
For more information on this function and varip please see our Using `varip` variables publication.
`timeFrom( )`
When plotting lines , boxes , and labels one often needs to calculate an offset for past or future end points relative to the time a condition or point occurs in history. Using xloc.bar_index is often the easiest solution, but some situations require the use of xloc.bar_time . We introduce `timeFrom()` to assist in calculating time-based offsets. The function calculates a timestamp using a negative (into the past) or positive (into the future) offset from the current bar's starting or closing time, or from the current time of day. The offset can be expressed in units of chart timeframe, or in seconds, minutes, hours, days, months or years. This function was ported from our Time Offset Calculation Framework .
`formattedNoOfPeriods()` and `secondsToTfString()`
Our final two offerings aim to confront two remaining issues:
How much time is represented in a given timestamp?
How can I produce a "simple string" timeframe usable with request.security() from a timeframe expressed in seconds?
`formattedNoOfPeriods()` converts a time value in ms to a quantity of time units. This is useful for calculating a difference in time between 2 points and converting to a desired number of units of time. If no unit is supplied, the function automatically chooses a unit based on a predetermined time step.
`secondsToTfString()` converts an input time in seconds to a target timeframe string in timeframe.period string format. This is useful for implementing stepped timeframes relative to the chart time, or calculating multiples of a given chart timeframe. Results from this function are in simple form, which means they are useable as `timeframe` arguments in functions like request.security() .
█ NOTES
Although the example code is commented in detail, the size of the library justifies some further explanation as many concepts are demonstrated. Key points are as follows:
• Pivot points are used to draw lines from. `timeFrom( )` calculates the length of the lines in the specified unit of time.
By default the script uses 20 units of the charts timeframe. Example: a 1hr chart has arrows 20 hours in length.
• At the point of the arrows `formattedNoOfPeriods()` calculates the line length in the specified unit of time from the input menu.
If “Use Input Time” is disabled, a unit of time is automatically assigned.
• At each pivot point a label with a formatted date or time is placed with one of the three formatting helper functions to display the time or date the pivot occurred.
• A label on the last bar showcases `secondsSince()` . The label goes through three stages of detection for a timed alert.
If the difference between the high and the open in ticks exceeds the input value, a timer starts and will turn the label red once the input time is exceeded to simulate a time-delayed alert.
• In the bottom right of the screen `secondsToTfString()` posts the chart timeframe in a table. This can be multiplied from the input menu.
Look first. Then leap.
█ FUNCTIONS
formattedTime(timeInMs, format)
Converts a UNIX timestamp (in milliseconds) to a formatted time string.
Parameters:
timeInMs : (series float) Timestamp to be formatted.
format : (series string) Format for the time. Optional. The default value is "HH:mm:ss".
Returns: (string) A string containing the formatted time.
formattedDate(timeInMs, format)
Converts a UNIX timestamp (in milliseconds) to a formatted date string.
Parameters:
timeInMs : (series float) Timestamp to be formatted.
format : (series string) Format for the date. Optional. The default value is "yyyy-MM-dd".
Returns: (string) A string containing the formatted date.
formattedDay(timeInMs, format)
Converts a UNIX timestamp (in milliseconds) to the name of the day of the week.
Parameters:
timeInMs : (series float) Timestamp to be formatted.
format : (series string) Format for the day of the week. Optional. The default value is "EEEE" (complete day name).
Returns: (string) A string containing the day of the week.
secondsSince(cond, resetCond)
The duration in milliseconds that a condition has been true.
Parameters:
cond : (series bool) Condition to time.
resetCond : (series bool) When `true`, the duration resets.
Returns: The duration in seconds for which `cond` is continuously true.
timeFrom(from, qty, units)
Calculates a +/- time offset in variable units from the current bar's time or from the current time.
Parameters:
from : (series string) Starting time from where the offset is calculated: "bar" to start from the bar's starting time, "close" to start from the bar's closing time, "now" to start from the current time.
qty : (series int) The +/- qty of units of offset required. A "series float" can be used but it will be cast to a "series int".
units : (series string) String containing one of the seven allowed time units: "chart" (chart's timeframe), "seconds", "minutes", "hours", "days", "months", "years".
Returns: (int) The resultant time offset `from` the `qty` of time in the specified `units`.
formattedNoOfPeriods(ms, unit)
Converts a time value in ms to a quantity of time units.
Parameters:
ms : (series int) Value of time to be formatted.
unit : (series string) The target unit of time measurement. Options are "seconds", "minutes", "hours", "days", "weeks", "months". If not used one will be automatically assigned.
Returns: (string) A formatted string from the number of `ms` in the specified `unit` of time measurement
secondsToTfString(tfInSeconds, mult)
Convert an input time in seconds to target string TF in `timeframe.period` string format.
Parameters:
tfInSeconds : (simple int) a timeframe in seconds to convert to a string.
mult : (simple float) Multiple of `tfInSeconds` to be calculated. Optional. 1 (no multiplier) is default.
Returns: (string) The `tfInSeconds` in `timeframe.period` format usable with `request.security()`.

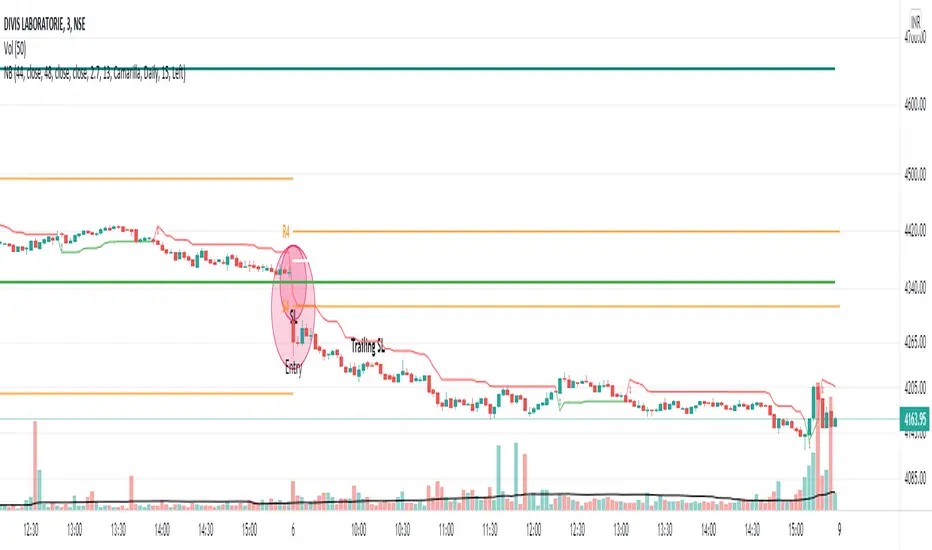
NoBrain BreakoutUse 3min. Time frame.
Buy Stock Selection:-
When Close Price Cross Monthly Standard Pivot R1 & Monthly Standard Pivot R1 is Greater than Previous Day High( PDH ) Or Close.
Price must be Above 44 MA ,48 EMA & Vwap
***Buy When 3min Candle closed Above Camarilla R4 or Monthly Standard Pivot R1 whichever is High.
Sell Stock Selection:-
When Close Price Cross Monthly Standard Pivot S1 & Monthly Standard Pivot S1 is Less than Previous Day Low( PDL ) Or Close.
Price must be Below 44 MA ,48 EMA & Vwap
***Sell When 3min Candle closed Below Camarilla S4 or Monthly Standard Pivot S1 whichever is Low.
Trading time for
1st wave 9.30am to 10.45am.
2nd wave 12.45pm to 2.45pm.
(Based on NSE/ BSE India)
Indicators:-
1) Pivot Points Standard - Time Frame monthly.only select R1
2) Pivot Points Camarilla- Only select R4.
3) SMA 44
4) EMA 48
5) Vwap
6) For Trailing Stop Loss use SuperTrend- Length-13 Factor-2.7 or Length-15 Factor-3 (3min Timeframe)
McDonald's Pattern [LuxAlgo]Tradingview asked, we delivered. This script fits a cubic Bezier curve using tops/bottoms in order to approximate a McDonalds pattern, a popular meme pattern in the crypto trading community.
Traditionally the McDonalds pattern is described by an M pattern with deep retracement (> 50%), forming a McDonalds logo.
Please note that this indicator is a meme & should not be taken seriously. Some aspects of this indicator are not real-time and meant for descriptive analysis alongside other components of this script, in this case, for entertainment purposes. We suggest looking through our other open-source scripts if you’re looking for more serious tools.
🔶 USAGE
The script fits Bezier curves using specific tops/bottoms as control points. When the distance between tops and bottoms values is relatively small, the user can more easily identify the pattern.
A score is shown on the top right of the chart, aiming to return how close the returned pattern is to the original logo.
A regular Mcdonalds pattern would return a red background, while an inverted pattern would return a green one.
🔶 SETTINGS
Length: Sensitivity of tops/bottoms detection. The method does not make use of pivot points, using rolling maximums/minimums instead.
Use First Bar As Vertex: Use the price and bar index of the last bar as vertex.

K's EnvelopesTrading is all about finding reactionary levels from where we assume prices will take a certain direction. And from that assumption, we initiate either a long (Buy) position or a short (Sell) position. Many techniques can be used to find support and resistance levels such as pivot points, Fibonacci retracements, and graphical levels. However, these techniques are all static in time, i.e. they do not move with real time data. In contrast, moving averages are dynamic and do a great job at finding support and resistance levels.
The idea of K's Envelopes is to form support and resistance zones so that we find good entry points. It is a combination of two 800-period moving averages where one is applied to the highs and the other applied to the lows, thus forming a moving zone used to support or place a ceiling on the market price.
